Artists · Billboard Hot 100
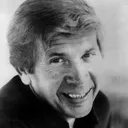 Buck Owens
Charting Jul 4, 1964 → Mar 12, 1966 · 23 weeks with chart power
Charted in 1 of 2 markets — Billboard Hot 100 23 wk
- Peak Power
- 0.65%
- week of Mar 13, 1965
- Career Power
- 12
- share-weeks
- Crowns
- 0
- weeks crowned Artist of the Week
- Peak Year
- 10
- May 1964 – May 1965
- Peak Five Years
- 12
- March 1961 – March 1966
- Top-five weeks
- 0
- weeks ranked 1–5
- Longevity
- 23
- weeks with chart power
- Dominance
- 1.55%
- week of Feb 27, 1965
- Comebacks
- 0
- none detected
Ranked by weekly Power Share, part of the ChartReign Power model — not the chart's own positions. How it works →
Songs on the Billboard Hot 100
5 records · 12 share-weeks of Career Power
Power contributed is what each song earned this artist: their weekly Power Share, split across their songs (a featured credit takes its reduced share). Record Power is the song's own figure, the same for every artist on it. Bar length compares songs within this list.
| Song | Peak | Weeks | On chart | Power contributedPower | Record Power |
|---|---|---|---|---|---|
| I've Got A Tiger By The TailApple Music | #25 | 9 | 8.4 | ||
| Waitin' In Your Welfare LineApple Music | #57 | 7 | 2.3 | ||
| I Don't Care (Just As Long As You Love Me)Apple Music | #92 | 3 | 0.5 | ||
| Before You GoApple Music | #83 | 2 | 0.4 | ||
| My Heart Skips A BeatApple Music | #94 | 2 | 0.3 |
30-second previews and store links from Apple Music.
At their peak
1964 in music →Buck Owens's best twelve months on the Billboard Hot 100 ran from May 1964 to May 1965. The most powerful artists over those weeks:
- 1The Beatles176
- 2The Supremes142
- 3The Beach Boys108
- 4The Dave Clark Five102
- 5Gerry And The Pacemakers95
- 6Roger Miller77
- 7Dean Martin77
- 8Herman's Hermits77
- 9Peter And Gordon74
- 10The Impressions74
Ranked by Era Power over the same weeks.
Their decade: the 1960s.