Artists · Billboard Hot 100
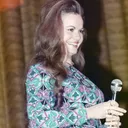 Jeannie C. Riley
Charting Aug 24, 1968 → Aug 21, 1971 · 33 weeks with chart power
Charted in 2 of 2 markets — Billboard Hot 100 33 wk, UK Singles Chart 15 wk
- Peak Power
- 2.14%
- week of Nov 9, 1968
- Career Power
- 40
- share-weeks
- Crowns
- 0
- weeks crowned Artist of the Week
- Peak Year
- 39
- April 1968 – April 1969
- Peak Five Years
- 40
- September 1966 – August 1971
- Top-five weeks
- 7
- weeks ranked 1–5
- Longevity
- 33
- weeks with chart power
- Dominance
- 3.61%
- week of Sep 21, 1968
- Comebacks
- 0
- none detected
Ranked by weekly Power Share, part of the ChartReign Power model — not the chart's own positions. How it works →
Songs on the Billboard Hot 100
5 records · 40 share-weeks of Career Power
Power contributed is what each song earned this artist: their weekly Power Share, split across their songs (a featured credit takes its reduced share). Record Power is the song's own figure, the same for every artist on it. Bar length compares songs within this list.
| Song | Peak | Weeks | On chart | Power contributedPower | Record Power |
|---|---|---|---|---|---|
| Harper Valley P.T.A.Apple Music | #1 | 13 | 35.3 | ||
| The Girl Most LikelyApple Music | #55 | 6 | 2.5 | ||
| Oh, SingerApple Music | #74 | 6 | 1.4 | ||
| There Never Was A TimeApple Music | #77 | 4 | 0.8 | ||
| Good Enough To Be Your WifeApple Music | #97 | 4 | 0.5 |
30-second previews and store links from Apple Music.
At their peak
1968 in music →Jeannie C. Riley's best twelve months on the Billboard Hot 100 ran from April 1968 to April 1969. The most powerful artists over those weeks:
- 1Aretha Franklin99
- 2Tommy James And The Shondells85
- 3The Beatles84
- 4The Temptations81
- 5Diana Ross & The Supremes79
- 6Steppenwolf77
- 7Marvin Gaye77
- 8Glen Campbell72
- 9The 5th Dimension71
- 10The Doors70
Ranked by Era Power over the same weeks.