Artists · UK Singles Chart
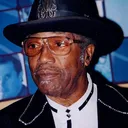 Bo Diddley
Charting Oct 10, 1963 → Aug 14, 2005 · 11 weeks with chart power
Charted in 2 of 2 markets — Billboard Hot 100 40 wk, UK Singles Chart 11 wk
- Peak Power
- 0.42%
- week of Nov 14, 1963
- Career Power
- 9
- share-weeks
- Crowns
- 0
- weeks crowned Artist of the Week
- Peak Year
- 5
- November 1962 – November 1963
- Peak Five Years
- 8
- April 1960 – April 1965
- Top-five weeks
- 0
- weeks ranked 1–5
- Longevity
- 11
- weeks with chart power
- Dominance
- 1.12%
- week of Oct 17, 1963
- Comebacks
- 0
- none detected
Ranked by weekly Power Share, part of the ChartReign Power model — not the chart's own positions. How it works →
Songs on the UK Singles Chart
3 records · 9 share-weeks of Career Power
Power contributed is what each song earned this artist: their weekly Power Share, split across their songs (a featured credit takes its reduced share). Record Power is the song's own figure, the same for every artist on it. Bar length compares songs within this list.
| Song | Peak | Weeks | On chart | Power contributedPower | Record Power |
|---|---|---|---|---|---|
| Pretty ThingApple Music | #34 | 6 | 5.2 | ||
| Hey Good Lookin | #39 | 4 | 3.2 | ||
| Bo Diddley/I'm a Man | #99 | 1 | 0.1 |
30-second previews and store links from Apple Music.
At their peak
1962 in music →Bo Diddley's best twelve months on the UK Singles Chart ran from November 1962 to November 1963. The most powerful artists over those weeks:
- 1Frank Ifield154
- 2The Beatles150
- 3Cliff Richard150
- 4The Shadows128
- 5Billy Fury105
- 6Gerry And The Pacemakers100
- 7Del Shannon95
- 8Roy Orbison91
- 9Brenda Lee90
- 10Tornados83
Ranked by Era Power over the same weeks.
Their decades: the 1960s, the 1970s, the 1980s, the 1990s, the 2000s.